
The proofgraph package automatically produces a graph of the dependencies
between the results (theorems, lemmas, propositions…) of a mathematical
article. Unlike other approaches, it requires no manual annotation: it
infers an edge from one result to another whenever the proof of the former
refers to the latter through an ordinary cross-reference (\ref, \cref,
\autoref…). A manual \uses command is also available for dependencies
that are not expressed through a visible reference.
The package writes a Graphviz .dot file describing
the graph, which can be rendered with dot (or, with shell-escape enabled,
rendered and embedded into the document automatically). It can:
- infer dependencies from cross-references inside proofs, with no annotation;
- capture
\ref, cleveref/hyperref variants (\cref,\autoref,\eqref…), manual\uses, and optionally\citeto external work (and, on request, the references made in the statements of the results themselves); - track proofs written in an environment of your own, not only
proof; - add dependencies on cited work by hand, for a proof that does not cite it visibly or a result stated without a proof;
- remove self-loops, suppress specific (e.g. unwanted forward) citations, and exclude chosen nodes;
- style nodes differently according to the type of result;
- optionally run Graphviz and include the rendered graph automatically.
The documentation of this package is provided in the proofgraph.pdf file,
produced from the documented source proofgraph.dtx.
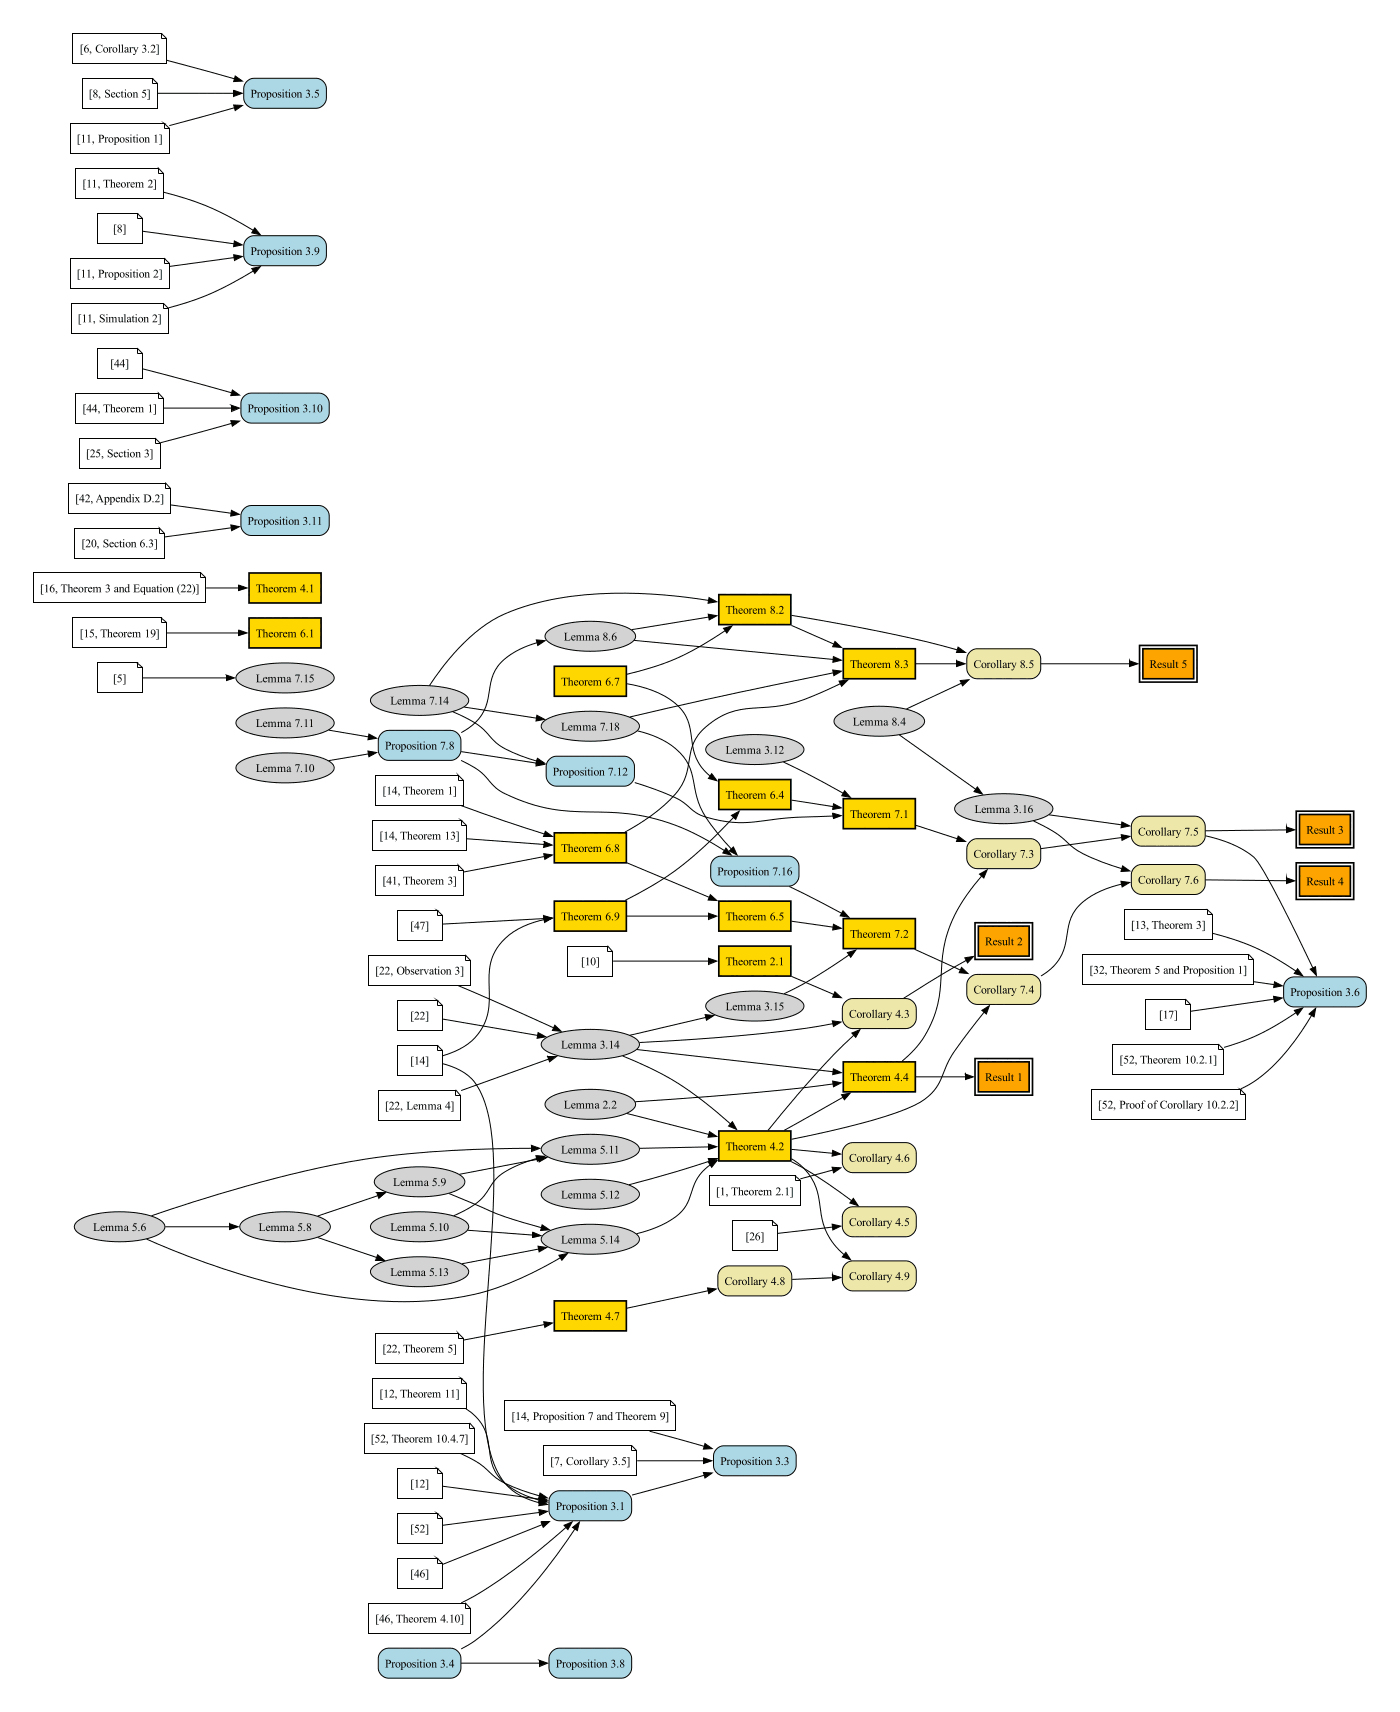
That is the graph of Connecting Knowledge Compilation Classes and Width
Parameters (doi:10.1007/s00224-019-09930-2),
essentially as published: 62 numbered results drawn from five environments, 24
external works and 114 edges. Beyond loading the package, all it took was
switching the cite option on, styling the five kinds of result, keeping one
environment out of the graph, and recording by hand, with twelve commands, the
dependencies that no visible cross-reference expresses: every other edge, and
the numbering of all 62 nodes, was inferred from the cross-references the proofs
already contained. The manual, which discusses this example in detail, is where
the figure comes from.
In addition to a working installation of LaTeX2e (October 2020 or later),
proofgraph relies on a few other packages, which should be provided by all
reasonable LaTeX distributions:
amsthmetoolboxxstringkvoptionsgraphicx(only to embed the rendered graph in the document with\proofgraph; not needed if you only emit and render the.dotfile)tikzandhyperref(optional, only to make the embedded graph's nodes clickable hyperlinks to their results; without them the graph is still embedded, just without links)
Rendering the .dot file into an image requires the external
Graphviz tool dot. Automatic rendering additionally
requires the document to be compiled with shell-escape enabled.
Simply copy the file proofgraph.sty in your LaTeX working directory, or in any
other directory where LaTeX searches for packages.
result-graph does for a
Lean 4 formalisation what proofgraph does for an article: it draws the
dependency graph of the results of a development, deliberately with the same
vocabulary, node styles and edge convention, so that the graph of a
formalisation and the graph of the paper it formalises look like one family.
There the dependencies are not inferred from cross-references but read off the
elaborated proof terms, and are therefore exact; and since a whole development
is far too large for one figure, it is sliced into a small neighbourhood of each
result.
Copyright © 2026 by Pierre Senellart.
This work may be distributed and/or modified under the conditions of the LaTeX Project Public License, either version 1.3 of this license or (at your option) any later version. The latest version of this license is in http://www.latex-project.org/lppl.txt and version 1.3 or later is part of all distributions of LaTeX version 2005/12/01 or later.
https://github.com/PierreSenellart/proofgraph
Pierre Senellart pierre@senellart.com
Bug reports and feature requests should preferably be submitted through the Issues feature of GitHub.