
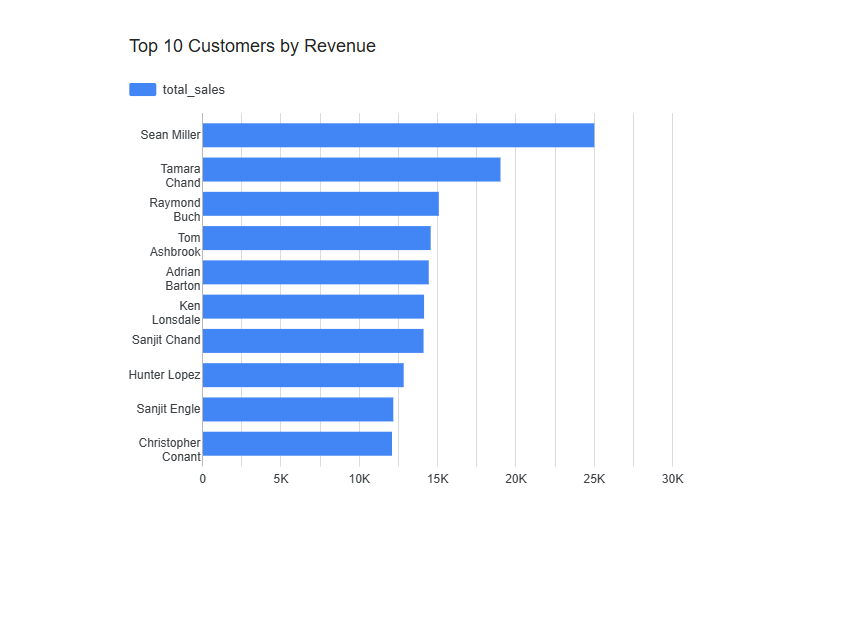
This project demonstrates an end-to-end analytics engineering pipeline using Google BigQuery, dbt, and Looker Studio.
Raw sales data is ingested into BigQuery, transformed through bronze / silver / gold layers using dbt, and visualized in Looker to surface business insights such as Top Customers by Total Sales.
Tech Stack
- Python (pandas)
- Google BigQuery
- dbt
- Looker Studio
- GitHub
CSV → BigQuery (Bronze)
→ dbt (Silver)
→ dbt (Gold)
→ Looker Studio Dashboard
- Python 3.10+
- Google Cloud project with BigQuery enabled
- dbt (
pip install dbt-bigquery) - Looker Studio access
python -m venv .venv
source .venv/bin/activate     # Mac/Linux
.venv\Scripts\activate # Windowspip install -r requirements.txtCreate a .env file in the project root:
GCP_PROJECT_ID= insert your project id
BQ_DATASET_BRONZE=bronze
BQ_DATASET_SILVER=silver
BQ_DATASET_GOLD=gold
SOURCE_CSV=storeanalytics.csv
.envis gitignored and should not be committed.
python -m ingestion.load_superstoreThis step:
- Creates the bronze table if it does not exist
- Loads ~9,800 rows of sales data
- Partitions the table by ingestion date
cd dbt
dbt debug --profiles-dir .
dbt run   --profiles-dir .
dbt test --profiles-dir .- Bronze: Raw ingested data
- Silver: Cleaned and standardized data
- Gold: Analytics-ready tables
Example gold models:
top_customerssales_by_categorydaily_sales
-
Open Looker Studio
-
Add data source → BigQuery
-
Select:
- Project:
dataengineering-387413 - Dataset:
gold - Table:
top_customers
- Project:
-
Create a horizontal bar chart
- Dimension:
customer_name - Metric:
total_sales - Sort: Descending
- Limit: Top 10
- Dimension:
The resulting dashboard highlights the highest revenue-generating customers.
Screenshots are available in the /dashboards folder.
A small number of customers account for a disproportionate share of total revenue, indicating opportunities for targeted retention and account growth strategies.