python: 3.10
Please make sure you have installed the following libraries:
flask
PyQt6
PyQt6-WebEngine
requests
flask-cors
webbrowser
You can also find the dependencies in the
requirements.txtfile.
pip install -r requirements.txtFirstly, this is a client-server architecture. Before starting any other programs, make sure that start_server.py has been launched, run
python start_server.pyIn test_client.py, we prepared 8 cases to visualize our relation map, respectively,
test_graph1
test_graph2
test_graph3
test_graph3_pos
test_graph3_neg
test_graph1_multi
test_graph2_multi
test_graph3_multi
As the name suggests, for each of the three graphs, we have prepared both single-data and multiple-data versions. Graph 3, due to its positive and negative sentiment, has three variations.
For visualization, simply run any function of unit_test in test_client.py.
Note: The visualization part utilizes PyQt. Due to limitations with threads, we have opted for a multiprocessing approach to display the visualized images. Therefore, if you intend to run all test units directly from
test_test_client.py, you need to consider the configuration of your local machine in advance.
Right-clicking the mouse, you will find three types of options: Save, Refresh, and Browser.
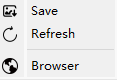
"Save" option saves the currently generated image to the default location (takes a screenshot), E:\code\python is absolute parent directory for the project.
"Refresh" option is to regenerate the current page. Please note that this will disrupt all your position adjustments.
"Browser" option is to generate your image in your system default browser.
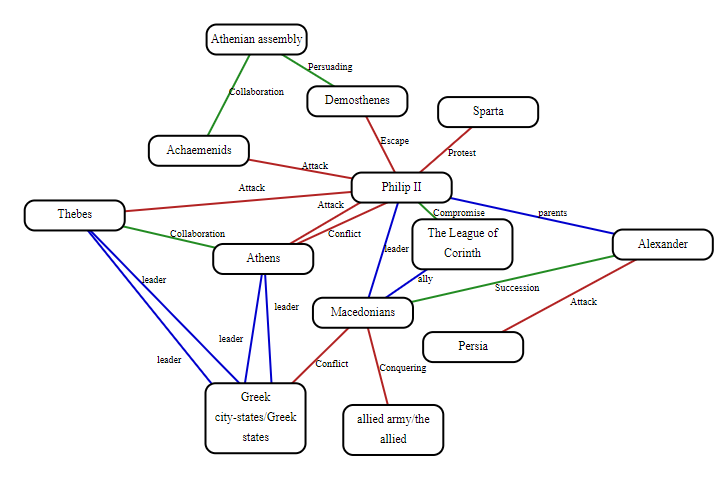
Here is the visualization 1 for data in Appendix. As you can see, the program automatically generated an image, trying its best to avoid collisions. However, in reality, there are still some overlapping contents.
In fact, our nodes and relationship content can be automatically dragged into position. You can adjust them to a visually pleasing layout.
Only internal nodes with POS, NEG, NEU relationships between entities within the cluster can be dragged, while the cluster as a whole can be dragged.
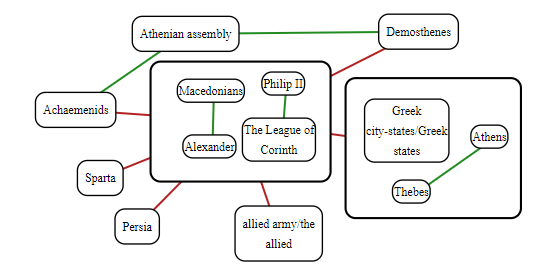
Graph3
Internal nodes can all be dragged, and at the same time, scrolling the mouse wheel over the innermost circle can adjust its radius. NEG and POS can be dragged as a whole.
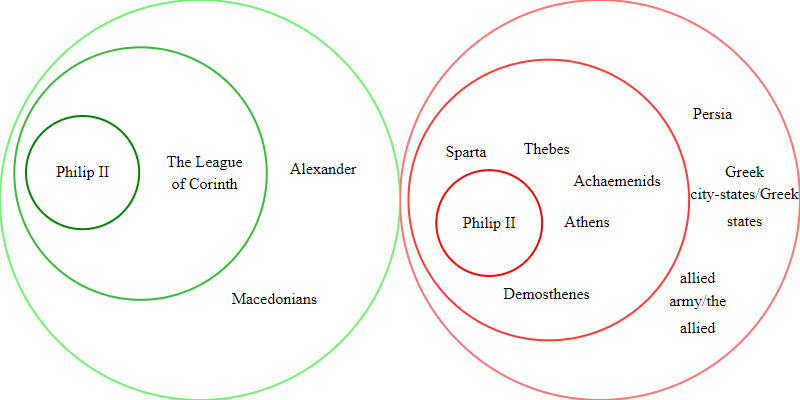
Note: Using
ctrl+ mouse scroll allows you to zoom in and out on all elements.
 [
    [
        "Macedonians",
        "Philip II",
        "leader",
        "REL",
        1
    ],
    [
        "Greek city-states/Greek states",
        "Athens",
        "leader",
        "REL",
        1
    ],
    [
        "Greek city-states/Greek states",
        "Thebes",
        "leader",
        "REL",
        1
    ],
    [
        "Greek city-states/Greek states",
        "Athens",
        "leader",
        "REL",
        1
    ],
    [
        "Greek city-states/Greek states",
        "Thebes",
        "leader",
        "REL",
        1
    ],
    [
        "The League of Corinth",
        "Macedonians",
        "ally",
        "REL",
        1
    ],
    [
        "Philip II",
        "Alexander",
        "parents",
        "REL",
        1
    ],
    [
        "Macedonians",
        "Greek city-states/Greek states",
        "Conflict",
        "NEG",
        1
    ],
    [
        "Philip II",
        "Athens",
        "Conflict",
        "NEG",
        1
    ],
    [
        "Philip II",
        "Demosthenes",
        "Escape",
        "NEG",
        1
    ],
    [
        "Demosthenes",
        "Athenian assembly",
        "Persuading",
        "POS",
        1
    ],
    [
        "Athenian assembly",
        "Achaemenids",
        "Collaboration",
        "POS",
        1
    ],
    [
        "Athens",
        "Thebes",
        "Collaboration",
        "POS",
        1
    ],
    [
        "Philip II",
        "Athens",
        "Attack",
        "NEG",
        1
    ],
    [
        "Philip II",
        "Thebes",
        "Attack",
        "NEG",
        1
    ],
    [
        "Macedonians",
        "allied army/the allied",
        "Conquering",
        "NEG",
        1
    ],
    [
        "Philip II",
        "Sparta",
        "Protest",
        "NEG",
        1
    ],
    [
        "The League of Corinth",
        "Philip II",
        "Compromise",
        "POS",
        1
    ],
    [
        "Philip II",
        "Achaemenids",
        "Attack",
        "NEG",
        1
    ],
    [
        "Macedonians",
        "Alexander",
        "Succession",
        "POS",
        1
    ],
    [
        "Persia",
        "Alexander",
        "Attack",
        "NEG",
        1
    ]
]